
Streamlit | Data Analytics Project
Baltimore County Real Estate Price Forecast Dashboard
A Data Analytics and Predictive Modeling Project Using Zillow ZHVI Data
Overview
This project delivers a fully reproducible end-to-end data analytics and forecasting system that predicts 5-year home price trends for Baltimore County, Maryland.
Using Zillow's publicly available ZHVI dataset, I built:
- A clean data pipeline (raw to processed to model-ready)
- A predictive forecasting engine
- A fully interactive Streamlit dashboard for real-time exploration
- A clear, repeatable workflow that mirrors production-grade analytics projects
This project demonstrates my capabilities across data engineering, statistical modeling, visualization, and product design, presented through a tool that solves meaningful real-estate decision problems.
Problem
Real estate investors, homebuyers, and agents often struggle to understand:
- How prices have changed historically
- Which ZIP codes are growing faster than others
- What home values may look like in the next 5 years
- Whether a ZIP code is trending upward or downward
Baltimore County has dozens of ZIP codes with different market dynamics. Without clean historical data and a clear forecasting framework, it's difficult to make confident, data-backed decisions.
Solution
I created an interactive 5-year real estate price forecasting dashboard that provides:
1. ZIP Code-Level Historical Trends
Users can select any Baltimore County ZIP to instantly view:
- 20+ years of median home value history
- Seasonally smoothed price curves
- Growth and decline periods
2. Predictive Forecasting for the Next 5 Years
Every ZIP code includes:
- Forecasted median home value
- Expected 5-year percentage growth
- Annualized growth rate (CAGR)
- A combined historical + forecast chart
3. Clean, Reusable Data Pipeline
The system automatically:
- Filters the national ZHVI dataset down to Baltimore County
- Reshapes and normalizes the time series
- Builds forecast metrics
- Produces easily exportable, analysis-ready datasets
4. User-Friendly Streamlit Interface
The dashboard is simple, intuitive, and built for real-world stakeholders:
- Agents can compare ZIP codes
- Investors can identify growth opportunities
- Homebuyers can evaluate long-term value trends
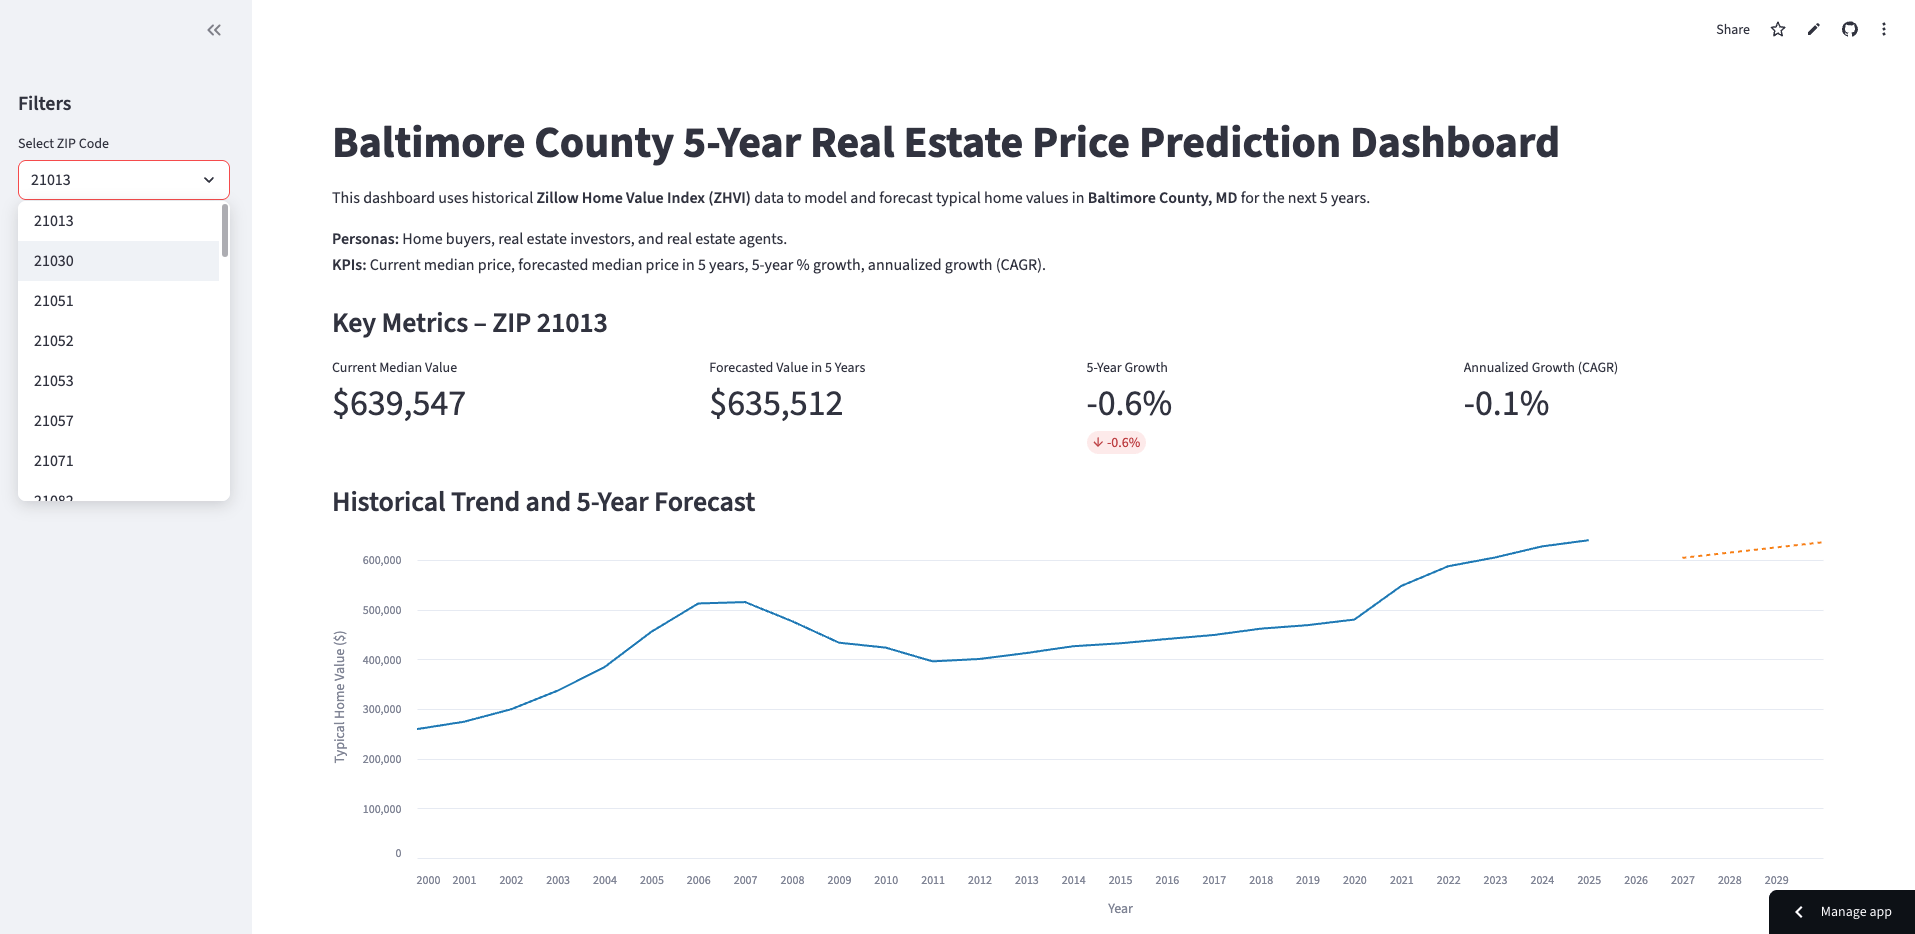
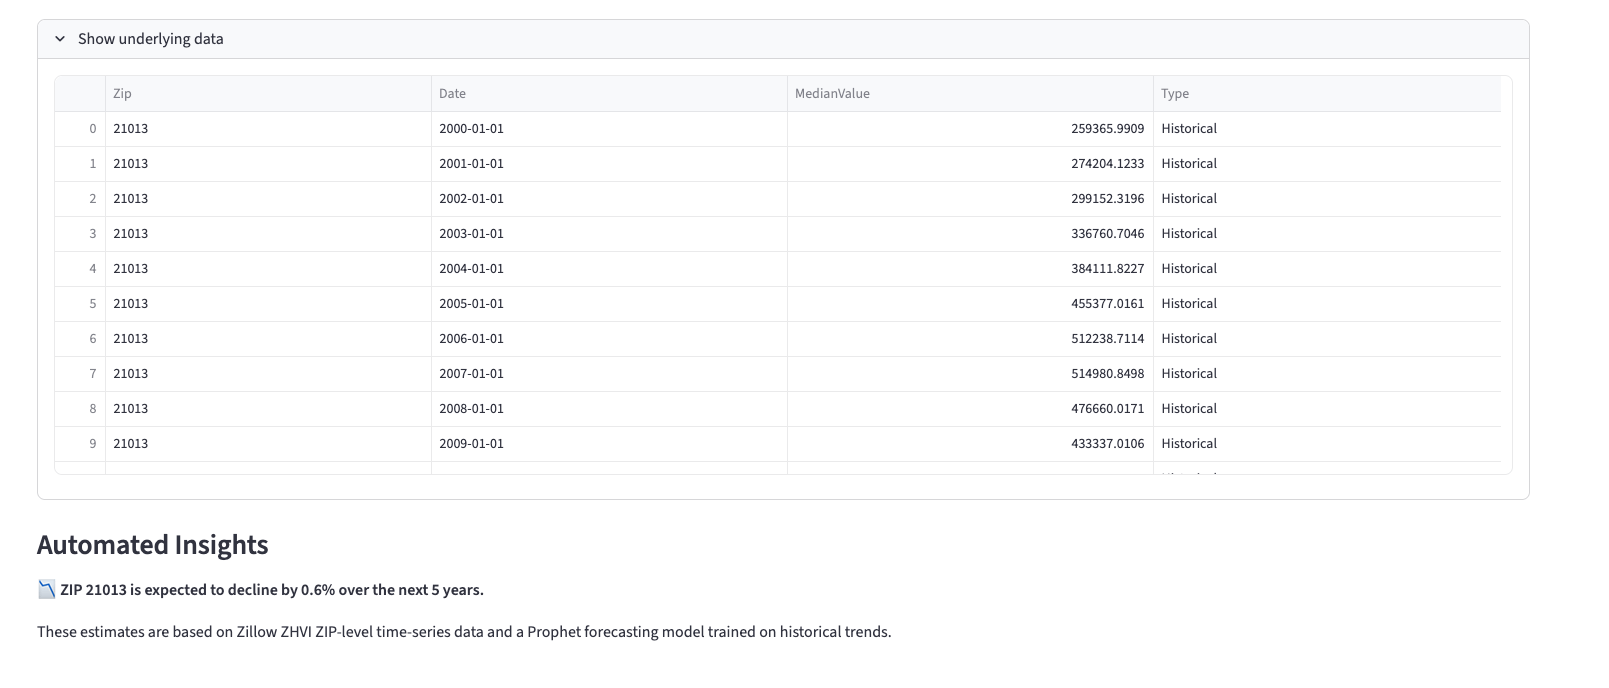
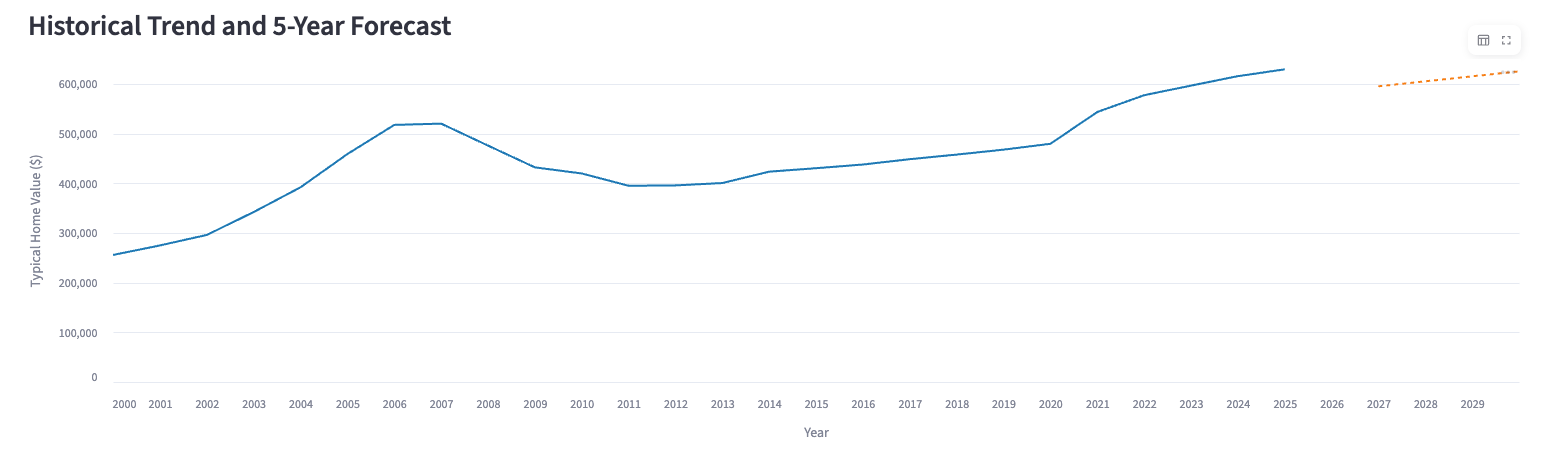
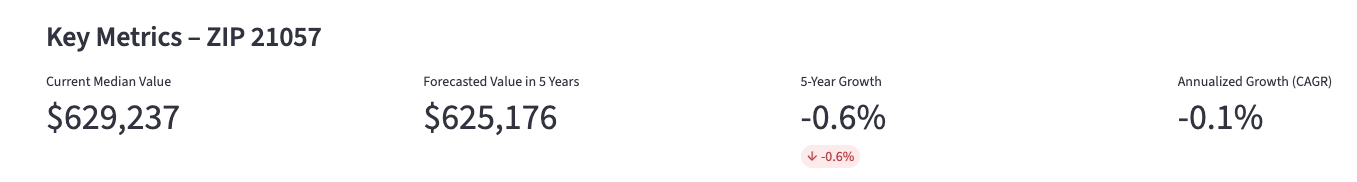
Dashboard Preview
Main Dashboard View
Interactive dashboard with ZIP code selector, key metrics, historical trends, and 5-year forecasts.
Underlying Data Table
Detailed time-series data by ZIP code with automated insights and forecasting methodology notes.
ZIP Code Trend Chart
Shows market behavior over time, including peaks, dips, and long-term appreciation.
Forecast KPIs View
Displays projected median value, 5-year growth percentage, and annualized return.
Modeling Approach
This project focuses on transparent, explainable forecasting - not black-box ML.
Key components:
- Year-over-year median value tracking
- Rolling trend estimation
- 5-year forward projection using baseline + slope extension
- Computation of future median value
- CAGR estimation for investment-style returns
This forecasting method is intentionally interpretable, making it ideal for non-technical users.
Tech Stack
Languages and Tools
- Python
- Jupyter Notebook
- Pandas, NumPy
- Streamlit
- Matplotlib / Plotly
Data
- Zillow ZHVI (https://www.zillow.com/research/data/)
- Processed datasets exported for analysis
- Dashboard-ready data outputs
Business Impact
For Real Estate Agents
- Educate clients with objective, data-backed insights
- Demonstrate local market expertise
- Identify ZIP codes with accelerating home values
For Investors
- Compare markets for potential deals
- Understand long-term appreciation patterns
- Identify risk-adjusted opportunities
For Homebuyers
- Understand whether the ZIP code is trending up or down
- Make more confident buying decisions
- Evaluate long-term value of specific neighborhoods
What I Learned
Building this project strengthened my skills in:
- Structuring end-to-end analytics systems
- Managing large datasets efficiently
- Designing user-centered dashboards
- Communicating insights to non-technical audiences